Aplikacje / in-line thickness measurement of carbon primer on battery current collector foils
01 — Introduction
Carbon primer: one micron between the foil and the electrode
In a lithium-ion cell, the cathode active material is coated on a thin aluminium current collector foil. More and more foil producers and cell makers add a conductive carbon primer between the two: a layer of carbon black or graphite in a polymer binder, typically 0.5 to 2 µm thick per face, applied on both sides of the foil by roll-to-roll coating.
The primer does three jobs at once. It anchors the electrode coating to the smooth aluminium surface, it lowers the contact resistance between the active layer and the collector, and it protects the aluminium against corrosion by the electrolyte. It is now standard for LFP cathodes and high-power cells, and it is spreading with sodium-ion batteries, where aluminium foil is used on both the cathode and the anode side.
Li-ion cathodes (LFP, NMC) Sodium-ion cathodes and anodes High-power cells Supercapacitor electrodes
Because the primer is applied before the electrode, a defect in this layer is buried under the active material and only shows up later, as poor adhesion, higher internal resistance or ageing of the cell.
Figure 1 — Primed current collector, cross-section (not to scale)
The primer is coated on both faces of the aluminium foil. Each face is measured from its own side, without contact.
02 — Quality Requirements
Why primer thickness must be controlled on each face, across the full web
The primer window is narrow, and both sides of it cost money.
Too thin: adhesion and resistance issues
A locally thin or missing primer leaves bare aluminium in contact with the active layer. Adhesion drops, the electrode may delaminate during calendering or slitting, and the interfacial resistance rises. In the cell, this translates into lower power and faster ageing.
Too thick: lost energy density and wasted material
Every extra tenth of a micron of primer is inactive volume in the cell, multiplied by the length of foil wound in each cell. Over-coating also consumes carbon dispersion for no benefit and can affect the drying of the following layer.
Face-to-face and edge variations
The two faces are coated by different coating heads, sometimes on different passes, and they rarely end up identical. Near the uncoated margins, the wet film thins out before it stops. A single average value per face, or worse per foil, hides both effects. A dense map of each face is needed to see where the process really stands.
|
0.5 – 1.5 µm
Primer thickness per face covered by the calibration in this study
|
≤ 0.02 µm
Deviation from the reference on blind samples not used for calibration
|
|
up to 13 %
Difference between the two faces of the same foil, invisible in the per-face reference
|
up to −40 %
Primer loss at the very edge of the coated width, revealed by the full-width maps
|
03 — Measurement Challenges
Why a one-micron black layer escapes conventional gauges
A carbon primer combines everything that makes thickness measurement difficult: it is very thin, light, black, and sits on a foil that is itself only a few tens of microns thick and moves fast.
Areal-weight gauges: the foil drowns the primer
Beta and X-ray transmission gauges measure the total mass per unit area. One micron of carbon primer weighs around 1 g/m², while the aluminium foil underneath weighs about 40 g/m². The normal thickness tolerance of the foil alone is larger than the primer signal, so the gauge cannot tell a foil variation from a primer variation — and it cannot separate the two faces.
Geometric gauges: a sub-micron change on a flexible web
Laser triangulation, confocal or capacitive gauges measure the total thickness or the position of the surface. Detecting a few hundred nanometres of primer on a thin, fluttering foil is beyond their practical resolution in production, and they again need the foil thickness to be known exactly.
Laboratory methods: destructive and late
Scrape-and-weigh tests or cross-section microscopy give a reference, but on a few cut samples, hours after coating. Optical density or colour readings saturate on a black layer and give no thickness.
The case for photothermal thickness mapping
- The primer itself is measured, not the total weight or thickness of the foil.
- Each face is measured separately, so a drift on one coating head is identified immediately.
- Full-width maps reveal edge thinning and transverse gradients, not only an average.
- No contact with a fragile foil and a fresh coating.
04 — Technology Comparison
Why laser photothermal radiometry fits carbon primers
Enovasense’s patented laser photothermal radiometry measures the coating through its thermal properties. A modulated laser beam heats the surface very slightly; an infrared detector captures the heat that comes back; the thickness is extracted from the phase of this thermal response. A carbon primer absorbs the laser almost completely and conducts heat far less than aluminium, which gives a strong thermal contrast even below one micron. The highly conductive foil underneath acts as a heat sink, so the measurement responds to the primer rather than to the foil thickness.
| Criteria | Enovasense laser photothermal | Beta / X-ray areal-weight gauge | Scrape-and-weigh |
|---|---|---|---|
| Measures the primer alone | Yes | No — total mass of foil and coatings | Yes |
| Separates face A and face B | Yes — one head per face | No — transmission through both faces | Possible — with one sample per face |
| Sensitivity to foil thickness variations | Low | High — larger than the primer signal | None |
| Non-contact, non-destructive | Yes | Yes | No — sample is cut and stripped |
| Inline, full-width coverage | Yes — fixed heads or traversing scanner | Yes — traversing frame | No — a few points per coil |
| Radiation source | None — laser and infrared detector | Yes — radioactive or X-ray source | None |
05 — Metrological Performance
Case study: carbon primer from a current collector producer
A producer of coated current collector foils supplied primed aluminium foil at three primer levels, with two samples per level. Each sample was cut across the full coated width of the production line, so that the maps cover the web from one edge to the other. The same primer was coated on both faces of the foil, and the producer provided a reference value per level, expressed as an average thickness per face. Each face of each sample was mapped with an Enovasense sensor in a laboratory control station, without contact, using the following configuration:
| Sensor / measuring head | Point Sensor, T033 head |
| Working distance / spot diameter | 40 mm / 3.3 mm |
| Mapping | X–Y scanning in an HKL control station, 33 × 11 points per face, 20 mm pitch — 640 mm across the web, 200 mm along it |
| Samples | 3 primer levels × 2 full-width samples × 2 faces |
The figures reported below correspond to the measurement configuration used during this study. Actual performance on a given application depends on the optical system selected, on the primer formulation and on its thickness range.
Accuracy: calibration and blind validation
A linear calibration was established on one sample of each level, using the average of both faces against the producer’s reference. The fit is R² > 0.99 across the 0.5–1.5 µm range. The second sample of the lowest and highest levels was then measured blind, with no adjustment: the Enovasense result matches the reference within 0.02 µm. The calibration can therefore be used directly on new production samples of the same primer.
Figure 2 — Enovasense thickness vs producer reference
Each point is the average of both faces of one sample. Vertical bars: standard deviation over the map, which reflects the real non-uniformity of the coating — mostly the edges — rather than measurement noise.
What the average does not show: face-to-face difference
Measured face by face, the two sides of the same foil are not identical. On the thickest level, face A carries 1.33 µm and face B 1.17 µm on average — a 13 % difference that a single reference value per level cannot reveal. The duplicate sample shows the same split, which points to a systematic difference between the two coating heads rather than to a local defect.
Figure 3 — Full-width primer thickness maps of both faces, highest level
33 × 11 points per face, 20 mm pitch, common colour scale. The maps span the full coated width of the web; the uncoated margins lie just outside.
A stable web with a sharp edge drop
Averaging each column of the map gives the transverse profile of the primer. Across most of the web width, the primer is remarkably stable: on every sample, the central zone stays within a few percent of its mean. The thickness drops only at the very edge of the coated width, within the last 20 mm before the uncoated margin. The drop grows with the coated thickness: about 10 to 15 % on the thinner levels, up to 40 % on one edge of the thickest level, and it is stronger on one side of the web than on the other. The same pattern is found on the duplicate samples — this is process information, directly usable to set the edge trim or adjust the coating heads.
Figure 4 — Transverse primer profiles
Average of the points of each column, along the machine direction.
06 — Industrial Integration
From laboratory mapping to inline control of the coating line
Enovasense supports foil producers, cell makers and roll-to-roll line builders from the qualification of a new primer to the continuous control of production.
At-line laboratory control
Samples cut at the end of a roll are placed in an Enovasense control station that maps both faces automatically. The result gives the thickness per face, the edge profile and the transverse uniformity in minutes, without stripping the coating — the fastest way to qualify a new formulation, a new coating head setting or a new supplier.
Inline measurement and scanning
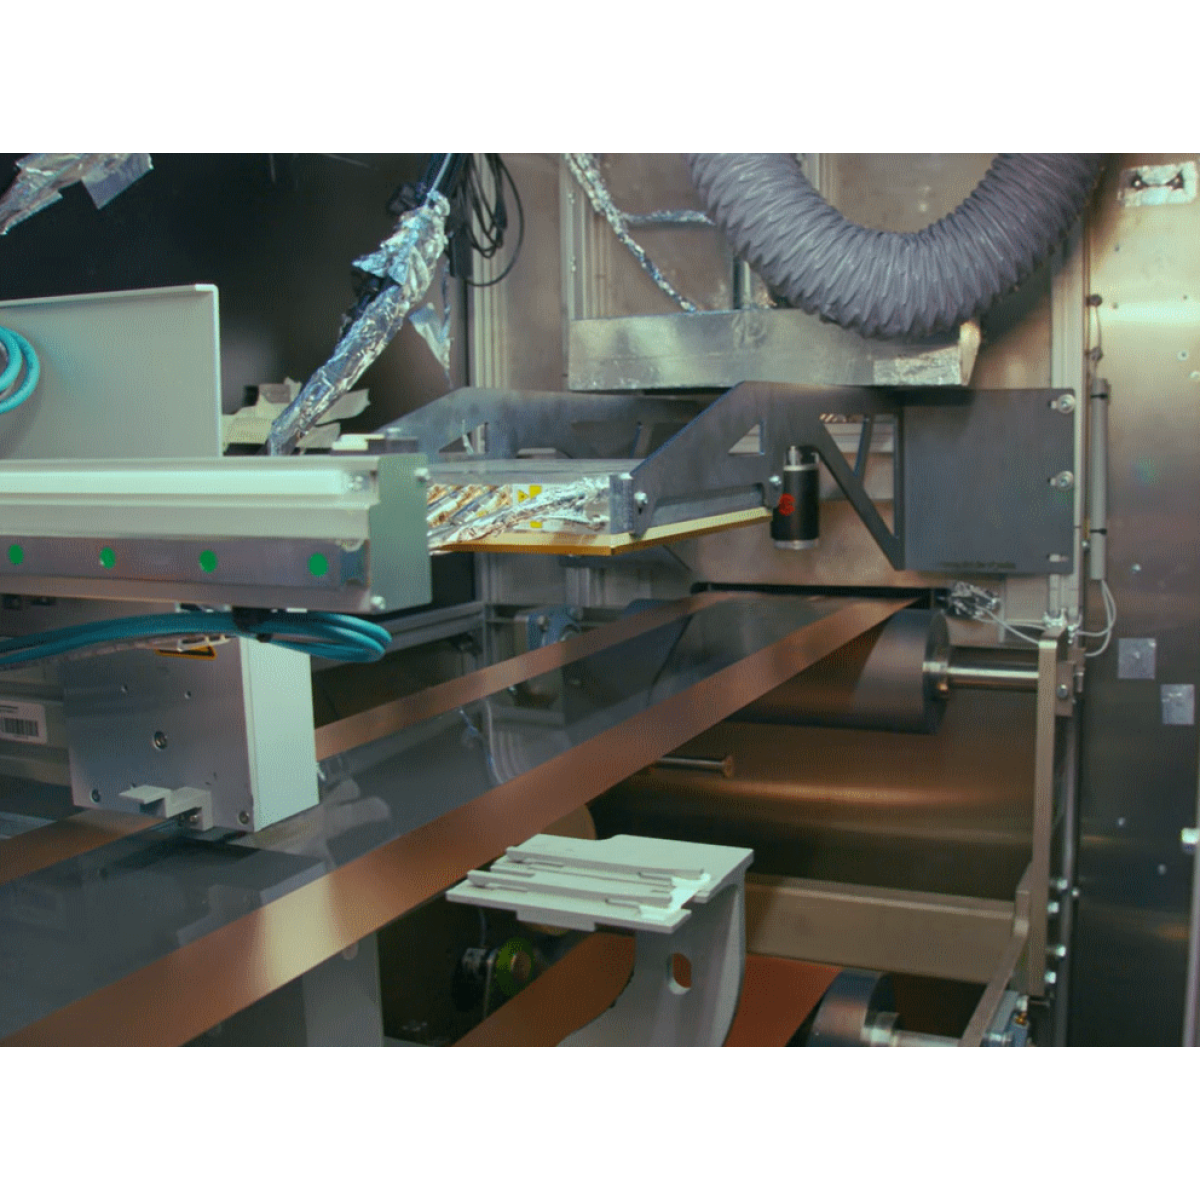
On the coating line, Enovasense measuring heads are installed after the drying oven, one on each face of the web. They can be mounted at fixed positions — typically at both edges and in the centre — or on a traversing scanner that sweeps the full width and builds a continuous thickness map of every roll. The working distance of several centimetres keeps the optics away from the foil, and air is blown on the exit window to keep it clean. Results are streamed in real time via Ethernet (TCP/IP) to the line control, for roll documentation, alarms and feedback to the coating heads.
Video — Enovasense inline measurement on a coil coating line
Hostowane przez YouTube, który zapisuje pliki cookie na Twoim urządzeniu.
Continuous, non-contact coating thickness measurement on a moving metal strip. This installation is on a coil coating line; the same measuring principle and integration approach apply to roll-to-roll primer coating of current collector foils.
Deployment steps

 English
 Deutsch
 Español
 Français
 Italiano
 日本語
 한국어
 中文