Applicazioni / non-contact thickness measurement of anodizing
01 — Introduction
Anodizing: a functional layer, not a cosmetic one
Aluminium anodizing is now a standard production process in many industrial sectors — aerospace, automotive, mechanical engineering and consumer electronics such as mobile devices. It is no longer limited to a cosmetic function: the anodic oxide layer directly determines corrosion resistance, mechanical durability, dielectric behaviour and compliance with industry regulations. Its thickness is therefore a functional variable that must be measured accurately to guarantee process conformity and effective surface protection.
The anodizing process
Anodizing is an electrochemical treatment. The aluminium part is immersed in an electrolytic bath — most often sulfuric acid — and connected as the anode of an electrical circuit. Under current, a porous aluminium oxide layer grows from the surface of the part itself; its thickness depends on the physical and chemical conditions of the bath (current density, temperature, concentration, immersion time). After anodizing, the layer can be coloured and is usually sealed to close its pores and improve corrosion resistance.
Sulfuric anodizing (SAA) Hard anodizing (HAA) Chromic anodizing (CAA) Tartaric-sulfuric (TSA) Thin decorative anodizing
Figure 1 — Anodizing line sequence
The Enovasense measurement is possible before or after sealing and colouring, with a calibration per process state.
Figure 2 — Structure of an anodic oxide layer (schematic)
The oxide grows partly into the substrate and partly outward: the layer is a low-conductivity, thermally insulating ceramic on a highly conductive metal — an ideal contrast for the photothermal method.
02 — Quality Requirements
Why anodic layer thickness must be controlled
The oxide thickness is specified by the applicable standard or customer specification — ISO 7599 and ISO 2360 for architectural and general anodizing, MIL-A-8625 and aerospace material specifications for hard and chromic anodizing, OEM specifications for consumer electronics. Each defines a thickness window, often with a local minimum and a mean value.
Too thin: insufficient protection
Below the specified minimum, corrosion resistance, abrasion resistance and dielectric strength are not achieved, and colouring may be uneven. On a consumer device casing, a thin or non-uniform layer shows as colour variation and premature wear of the finish.
Too thick: fatigue, dimensions and cost
Hard anodic layers reduce the fatigue strength of the aluminium substrate — a key concern on aerospace structural parts — and consume dimensional tolerance, since the oxide grows outward by roughly half its thickness. Over-anodizing also means longer immersion times and higher energy cost for no functional gain.
Bath drift and uniformity
Electrolyte concentration, temperature, current density and contact resistance on the jig all drift over time, and current distribution across the part and across the rack creates thickness differences between parts and between zones of the same part. Only frequent, non-destructive measurement on the parts themselves — rather than on witness coupons — captures these variations before a batch is out of tolerance.
|
1 – 25 µm
Thickness range covered in the intercomparison study on 8 aluminium alloy series
|
0.6 µm
Mean difference vs the eddy-current reference, with a 98 % correlation
|
|
Cg 1.52 / Cgk 1.45
Type 1 MSA gauge capability on a 12 µm sample — above the 1.33 acceptance threshold
|
from 0.3 µm
Lower limit of the measurable range — optimised configuration for thin decorative anodizing on consumer-electronics casings
|
03 — Measurement Challenges
Why anodic layer thickness is difficult to measure
Measuring anodized layers is inherently complex because of the nature of the process itself: the oxide is thin, porous, partly grown into the substrate, and present on parts of every shape and size. Two families of methods are generally used in industry, each with structural limitations.
Eddy current: contact, geometry and thin layers
Eddy-current gauges measure the lift-off of the probe from the conductive aluminium. They are simple and fast on flat, large parts, but they require contact, depend on probe orientation and are ineffective on thin layers (a few µm). Their reading also depends on the alloy conductivity and on the curvature of the part, so complex geometries need multiple calibrations and small parts or edges are simply out of reach. Each measurement is a point, often not representative of the whole part.
Optical interference: precise but hard to industrialise
White-light interferometry and spectral reflectometry analyse the interference between reflections at the air / oxide / aluminium interfaces. They reach very high precision on thin, uniform, smooth layers, but they need near-normal incidence, a flat surface and precise alignment, and they are very sensitive to roughness, porosity, scattering and vibration. This mechanical complexity makes them difficult to scale to production control.
What a production solution needs
- No contact and no alignment — tolerance to distance and angle so that curved, small or recessed areas can be measured.
- One calibration per anodizing process, valid across part geometries and alloys of a family.
- Full functional range, from thin decorative layers down to 0.3 µm up to hard anodizing.
- Mapping and automation — the uniformity across the part is a specification, not just a mean value.
04 — Technology Comparison
Why laser photothermal radiometry fits anodized aluminium
Enovasense’s patented laser photothermal radiometry (LPTR) heats the oxide surface by a few degrees with a modulated laser beam; the thermal wave diffuses through the oxide and reflects at the oxide–aluminium interface; an infrared detector captures the thermal response, whose phase shift is converted into thickness. The anodic layer — a thermally insulating ceramic on a highly conductive metal — gives a strong, clean photothermal contrast, which is why the method works from the thinnest decorative layers — down to 0.3 µm — to hard anodizing, on every aluminium alloy and every anodizing chemistry (sulfuric, hard, chromic), sealed or unsealed.
Because the measurement is non-contact, tolerant to distance and angle variations, and independent of part geometry, the same sensor measures a flat test panel, the inside radius of a machined housing or the chamfered edge of a phone casing with one calibration — making it an easily scalable solution for industrial deployment.
| Criteria | Enovasense laser photothermal | Eddy current | Optical interference (WLI / spectral reflectometry) |
|---|---|---|---|
| Measurement principle | Thermal diffusion response | Electrical conductivity / lift-off | Interference fringes at air / oxide / aluminium interfaces |
| Contact | Non-contact | Contact | Non-contact |
| Sensitivity to surface condition | Low to moderate | Moderate | Very high — roughness, porosity, scattering |
| Sensitivity to part geometry | Low — compatible with complex geometries | High — contact, orientation, multiple calibrations | Very high — near-normal incidence, flat surfaces |
| Local representativity | Local measurement with mapping capability | Point measurement, often non-representative | Very local measurement |
| Thin coatings (a few µm) | Yes — from 0.3 µm, all functional thicknesses | Limited accuracy on thin anodic layers | Very good on thin, uniform layers |
| Tolerance to distance variations | High | Low — contact | Very low |
| Automation / inline integration | High — robot integration, thickness mapping | Difficult | Not suitable |
| Measurement cycle velocity | High | High | Low — alignment, vibration sensitivity |
05 — Metrological Performance
Intercomparison on 8 alloy series, 1 to 25 µm
Enovasense technology has proven itself on real samples from industrial anodizing suppliers. To assess accuracy, a study was performed on samples whose thicknesses cover the whole tolerance interval, from 1 to 25 µm.
Eight aluminium alloy series were analysed — 1050, 2017, 2024, 2618, 5083, 6061, 6082 and 7075. For each series, eight samples were treated by sulfuric anodizing, with immersion times chosen to produce oxide thicknesses between 1 and 25 µm. The oxide thickness was measured with eddy current as the reference, and the Enovasense mean thickness of each sample was plotted against that reference.
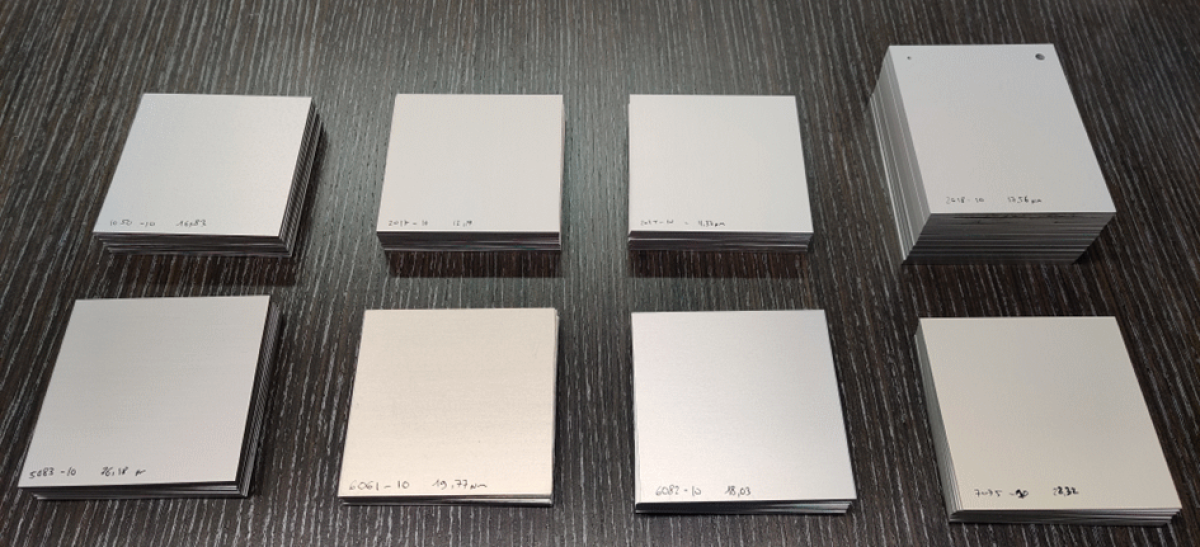
Sulfuric-anodized samples of the eight alloy series, 1 to 25 µm
Figure 3 — Enovasense laser photothermal vs eddy current, 64 anodized samples
Mean Enovasense thickness per sample against the eddy-current reference, one colour per alloy series. Schematic rendering of the study data.
A 98 % correlation is observed between the two techniques, with an average difference of only 0.6 µm across the eight alloy series — a single photothermal calibration covers alloys as different as 1050 and 7075.
Gauge capability: type 1 MSA study at 12 µm
A type 1 measurement system analysis was then performed on a sample in the middle of the range, with a reference value of 12 µm and a tolerance of 24 µm, by repeating the measurement 50 times at the same point.
Figure 4 — Type 1 gauge study, 12 µm anodized sample
Run chart of the repeated measurements against the reference value and the ±10 % tolerance band. Schematic rendering consistent with the study statistics.
- Bias: the p-value (0.237) is greater than the 0.05 significance level — the bias is not statistically significant and the gauge is accurately centred on the reference value.
- Capability: both Cg (1.52) and Cgk (1.45) exceed the standard threshold of 1.33, confirming that the measurement system is capable: its variation is small relative to the 24 µm tolerance.
Thin decorative anodizing, below 5 µm
The Enovasense configuration can be optimised for the thin anodic layers of mobile-device casings and other consumer-electronics parts, where the specified thickness is below 5 µm — the measurable range extends down to 0.3 µm. Eddy current does not perform well on this range, so optical interference techniques are widely used because of their high precision — at the cost of alignment, flatness and surface-condition constraints that are hard to meet on a curved, textured casing.
In a dedicated intercomparison on this low range, the Enovasense technology proved easier and faster to implement than optical techniques — no precise alignment, no impact of surface condition or part geometry — while showing similar accuracy and repeatability.
Performance figures correspond to the configurations used in these studies. Actual performance depends on the optical system selected, the anodizing process (sulfuric, hard, chromic; sealed or not) and the thickness range measured. A dedicated calibration is built per anodizing process.
06 — Industrial Integration
Integrating Enovasense sensors for anodic coatings
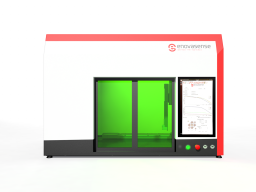
The Enovasense probes are compact and lightweight and tolerate distance and angle variations, so they suit both the anodizing shop laboratory and the production line. Two integration levels cover most needs.
 |
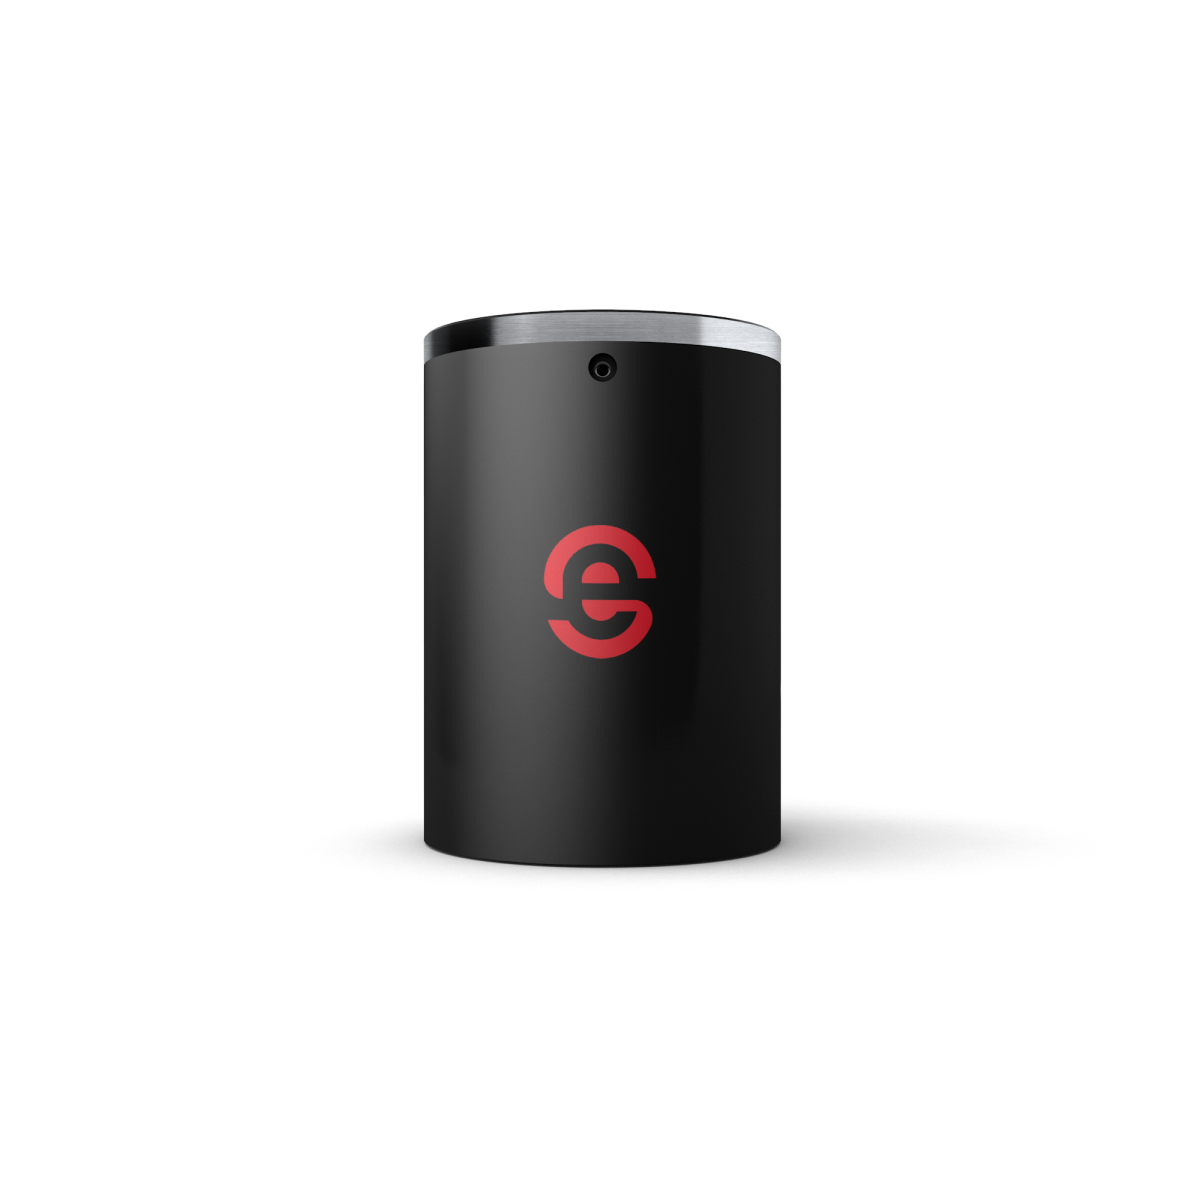 |
| HKL2 off-line control station — automated mapping and batch measurement | Compact Enovasense probe for six-axis robot integration |

Riferimenti
| Riferimento | Nome | Stato / Prezzo | Scheda tecnica |
|---|---|---|---|
| ANOD | Control station for aluminium anodizing thickness control |
Disponibile
Su preventivo |
English Français |
| ADVANTAGES | Why use Enovasense Hako L to measure aluminum anodizing thickness ? |
Disponibile
Su preventivo |
English |
Documenti
| Tipo | Nome | Scarica |
|---|---|---|
| Certification | Why use Enovasense HAKO L to measure aluminum anodizing ? | English |

 English
 Deutsch
 Español
 Français
 日本語
 한국어
 Polski
 中文