Applications / non-contact laser cladding coating thickness measurement on brake discs
01 — Introduction
Laser cladding: the brake-disc answer to Euro 7 particulate limits
Since the adoption of the Euro 7 standard in 2024, automotive manufacturers face a new kind of emission constraint: not only exhaust gases, but also non-exhaust particulate emissions — a large share of which comes from brake-disc wear. Conventional grey cast iron discs shed fine particles at every braking event. Laser cladding has therefore emerged as a key enabling technology: a hard, wear-resistant layer is metallurgically bonded onto the friction surface of the cast-iron disc, dramatically reducing wear and the particulate emissions that go with it.
Brake discs operate under severe conditions — high mechanical loads, elevated temperatures and repeated thermal cycles — that degrade the friction surface over time. The cladded layer protects that surface, improves wear resistance and extends component lifetime. In return, OEM specifications impose strict requirements on cladded-layer thickness and uniformity, and reliable, repeatable thickness control becomes a mandatory step of the production chain.
The laser cladding process
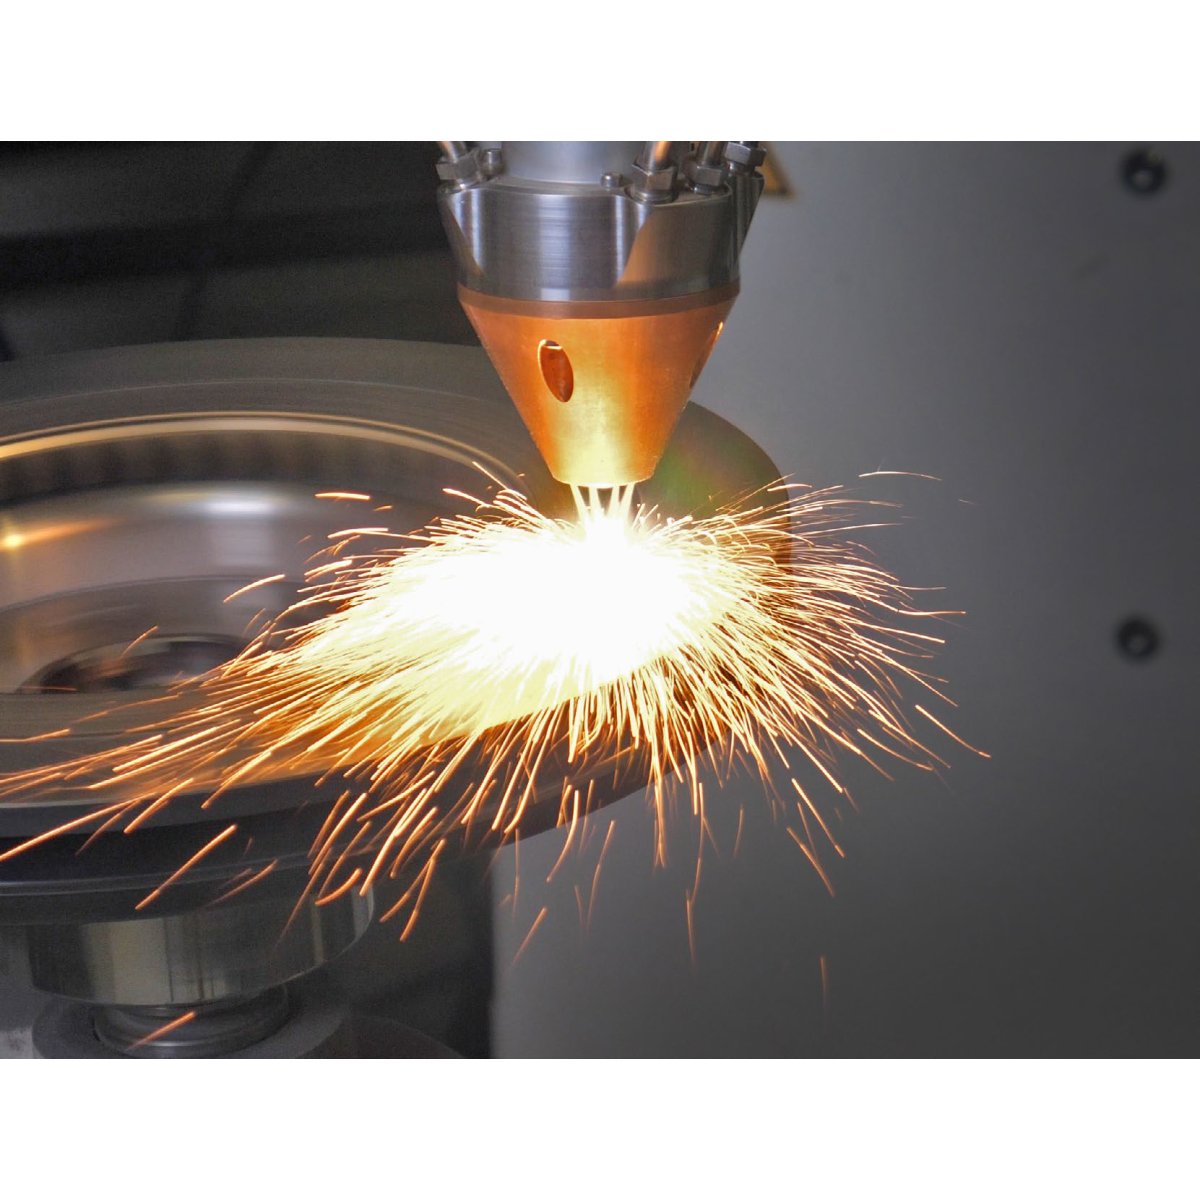
Laser cladding is a surface-treatment process in which a high-energy laser creates a small melt pool on the substrate surface while metal powder or wire is fed into it. A dense coating is formed, metallurgically bonded to the substrate. On brake discs the process is usually run in two passes, each with a distinct function:
Powder-fed cladding Wire-fed cladding Bond layer Carbide-reinforced wear layer
A first bond layer accommodates the metallurgical transition from the cast iron; a second wear layer, typically loaded with hard carbide particles, provides the friction and wear performance. After cladding, the disc is ground to its final geometry and roughness, which removes part of the as-deposited layer — making the remaining layer thickness the quantity that ultimately matters.
Figure 1 — Brake-disc laser cladding production sequence
Enovasense thickness control can be positioned after each cladding pass, after grinding, or at all three steps.
Figure 2 — Metallographic cross-section of a ground laser-cladded brake disc (schematic)
After grinding, the surface is perfectly flat. Both cladded layers share the same metallic matrix; only the upper wear layer contains the hard carbide particles that disturb many optical and distance-based measurement principles.
02 — Quality Requirements
Why cladded-layer thickness is the critical quality parameter
The wear life of a cladded disc — and therefore its particulate-emission performance over the vehicle lifetime — is governed directly by the thickness of the wear layer left after grinding. Too thin, and the disc will wear through to the bond layer or the cast iron prematurely; too thick, and process time, powder consumption and grinding effort increase without benefit. OEM specifications therefore define a thickness window and a uniformity requirement across the whole friction surface.
Thickness uniformity across the friction surface
Laser cladding produces a surface made of overlapping beads, with local thickness variations driven by melt-pool dynamics, powder-feed fluctuations and the thermal gradient that builds up across the disc during deposition. The inner and outer edges of the friction ring, where the cladding track starts and stops, are particularly sensitive. A single-point check cannot confirm that the specified minimum thickness is present everywhere: only a dense thickness map of the friction surface can.
Two layers, one total thickness
Because the functional coating is built in two passes, the quality question is often not the thickness of one layer, but the total thickness after both depositions — and the thickness that remains after grinding. The control method must therefore be able to measure the full stack on the finished part, without relying on a surface reference taken before cladding.
Process drift monitoring
Laser power, powder or wire feed-rate, scanning speed, nozzle wear and disc preheating all drift over time and collectively shift the deposited thickness. Monitoring every disc — or at least a dense, frequent sample — rather than a destructive cross-section every few hundred parts is the only way to detect such drifts before they generate large populations of non-conforming discs.
|
50 – 400 µm
Cladded-layer thickness range covered on brake discs, from thin bond layers to full two-layer stacks
|
100 %
Of the friction surface mapped non-destructively — not a handful of cut points
|
|
2 layers
Total stack thickness measured on the finished part, no pre-cladding reference needed
|
0 contact
Non-contact laser measurement — compatible with rough as-cladded and ground surfaces
|
03 — Measurement Challenges
Why laser cladding layers are difficult to measure
Measuring the thickness of a laser cladding layer is a real challenge. The as-deposited surface is rough and made of overlapping beads; the thickness varies locally with the dynamics of the melt pool; and the hard carbide particles embedded in the wear layer — there precisely to increase its resistance — disturb a number of measurement principles. As a result, many conventional thickness-measurement methods struggle to deliver repeatable and reproducible results on an industrial scale.
Metallographic cross-section: the reference, but destructive and local
Cutting, mounting and polishing a section of the disc and observing it under a microscope remains the reference method, accepted in all quality protocols. But it is destructive, inherently local and slow: one section documents a few millimetres of a friction surface that spans hundreds of square centimetres, and the result arrives hours or days after the disc left the cladding cell. It is incompatible with a representative assessment of thickness uniformity on large or complex parts, and useless for closing the loop on the process.
Height sensors and laser triangulation: a surface, not a layer
Distance-based methods measure the surface topography before and after deposition and infer the layer thickness by difference. Their accuracy depends strongly on surface geometry, roughness and local orientation — all unfavourable on a bead-textured cladding. More fundamentally, they need a reference measurement of the bare substrate: in a two-layer process, or once the disc has been ground, that reference is lost and the functional layer thickness can no longer be inferred from surface height alone.
What an industrial solution needs to deliver
- Measure the layer itself, not the surface position — so that the total thickness of a two-layer stack is available on the finished, ground disc.
- Tolerate roughness and carbides — the measurement must integrate over the bead texture and the microstructure rather than be disturbed by them.
- Map the whole friction surface — uniformity is a specification, so the method must produce a thickness map, not a point.
- Integrate in production — robot- or gantry-mounted, non-contact, fast enough to follow the cladding cell takt time.
04 — Technology Comparison
Why laser photothermal radiometry is the right tool for cladded discs
Enovasense’s patented laser photothermal radiometry (LPTR) measures the coating rather than its surface. A modulated laser beam generates a thermal wave in the cladded layer; an infrared detector captures the heat that diffuses back to the surface; the layer thickness is extracted from the characteristic time of that thermal response. Because the method relies on the integrated thermal response of the coating–substrate system, it is far less sensitive to local microstructural variations, bead roughness and carbide particles than optical or distance-based techniques — while remaining fully non-contact, non-destructive and compatible with industrial automation.
| Criteria | Enovasense laser photothermal | Height sensor / laser triangulation | Metallographic cross-section |
|---|---|---|---|
| Measurement principle | Thermal diffusion response of the layer | Surface topography before vs after deposition | Direct local observation of the cut layer |
| Non-destructive | Yes | Yes | No — disc is cut |
| Sensitivity to part geometry | Low to moderate — compatible with complex geometries | High — edges, curvature, accessibility | Low — selected location only |
| Thin coatings (a few µm) | Well suited | No | Possible — but noisy |
| Total thickness after 2-layer deposition | Suitable | Risk of losing the reference | Suitable |
| Automation / inline integration | High — robot integration, thickness mapping | Difficult | Not suitable |
| Measurement velocity | High | High | Extremely low |
05 — Metrological Performance
Validated with Mercedes and Fritz Winter on production discs
Enovasense has partnered with Fritz Winter and Mercedes within an industrial validation project aimed at developing and assessing laser-cladded brake-disc solutions for current and upcoming automotive emission requirements. Within this project, Mercedes and Fritz Winter validated the Enovasense laser-based thickness measurement on laser-cladded brake discs, across several industrial maturity levels, to monitor the cladded-layer thickness in representative production conditions.
Calibration and blind validation against cross-sections
Three discs with cladded-layer thicknesses ranging from 200 to 350 µm were measured with the Enovasense sensor and their response used to build the calibration. That calibration was then applied to validation samples of unknown thickness, which were subsequently cut and verified by micrographic cross-section. Figure 3 shows both data sets side by side.
Figure 3 — Intercomparison: destructive cross-section vs non-destructive Enovasense LPTR
Source: Mercedes – Fritz Winter – Enovasense validation project. Samples 1–17: three calibration discs (≈ 350, 300 and 200 µm). Samples 19–27: validation discs of unknown thickness, measured with the Enovasense calibration and then verified by cross-section microscopy. Values redrawn from the study data.
On the validation samples, the Enovasense measurements follow the cross-section reference closely across the whole 230–260 µm band, including the step between the thinner and thicker validation discs. There is a strong correlation between the values obtained by microscopic sectioning and those obtained by the Enovasense sensor — confirming that a calibration built on a few reference discs transfers to unknown production parts.
Full-surface uniformity mapping
Beyond point measurements, integrating the Enovasense sensor on a motion system allows a complete scan of the cladded friction surface. The resulting thickness map (Figure 4) reveals what no cross-section can: the radial thickness gradient between the inner and outer radius of the friction ring, the angular variations linked to the cladding track, and local thin spots at the ring edges where the track starts and stops.
Figure 4 — Thickness map of a laser-cladded brake disc friction surface
Schematic rendering of an Enovasense full-surface XY scan (automated motion + measurement cycle), one cell per measurement point. Colour scale 275–400 µm. The map highlights the radial gradient — thinner towards the inner radius, thicker towards the outer radius — and the local defects at the edges of the cladded ring.
Performance figures correspond to the measurement configuration used during the validation project. Actual performance on a given application depends on the optical system selected, the cladding alloy and carbide content, and the thickness range of the layer measured. A dedicated calibration is built for each cladding material system.
06 — Industrial Integration
Three ways to integrate Enovasense sensors for brake-disc control
The same non-contact sensor can be deployed at laboratory, pre-series and full production scale. Enovasense offers three integration levels, from a bench-top mapping station to a sensor mounted directly in the cladding line.
Video — The Enovasense HKLR robotic station measuring a laser-cladded brake disc
Hosted by YouTube, which places cookies on your device.
6-axis robot, programmed motion and measurement cycle, full-surface thickness mapping of the friction face.
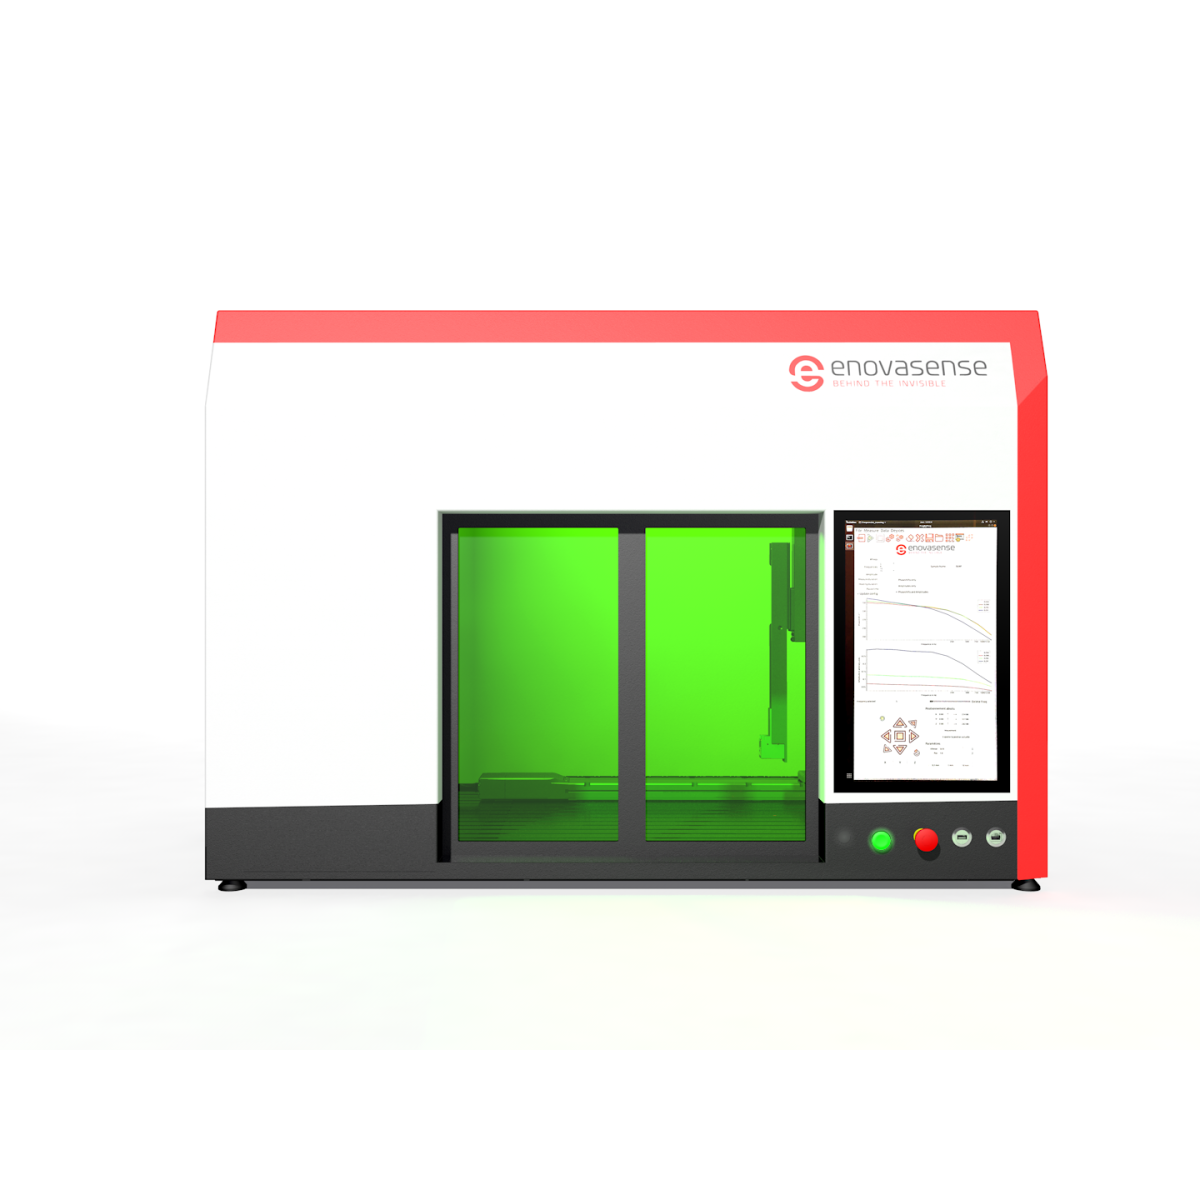
HKL2 control station — 3-axis thickness mapping of the friction face
Figure 5 — Integration levels, from lab to line

 English
 Deutsch
 Español
 Français
 Italiano
 日本語
日本語
 한국어
한국어
 Polski